Ultra performance LC with quadrupole TOF MS (UPLC/Q-TOF-MS) fingerprinting is first developed for the identification of the major components of Phellodendri Amurensis Cortex (PAC). The PAC samples are separated using a Waters ACQUITY UPLC BEH C18 (2.1×50 mm, 1.7 μm) by linear gradient elution using water (containing 0.2% formic acid) and acetonitrile (containing 0.2% formic acid) as the mobile phase. Ten batches of PAC are selected to construct the UPLC/Q-TOF-MS fingerprint. Sixteen common peaks in the fingerprint are obtained, ten of which are tentatively identified, with reference to the literature data, as phellodendrine, magnoflorine, tetrahydropjatrorrhizine, menisperine, tetrahydropalmatine, jatrorrhizine, palmatine, berberine, obacunone, and limonin. Chemometric methods are also employed to evaluate the variation of herbal drugs and other closely related herbs based on the characteristics of peaks in the UPLC/Q-TOF-MS profiles. The developed fingerprint assay is a powerful method that may be used to conduct quality control of PAC.
Newborn screening (NBS) helps in the early detection of inborn errors of metabolism (IEM). The most effective NBS strategy prevailing in clinics is tandem mass spectrometry (MS/MS) analysis using dried blood spot (DBS) samples. Taking lung cancer (LC) as an example, this study tried to explore if this technique could be of any assistance for the discovery of tumor metabolite markers.
Materials and methods
Twenty-six acylcarnitines and 23 amino acids, which are commonly used in IEM screening, were quantified using DBS samples from 222 LC patients, 118 benign lung disease (LD) patients, and 96 healthy volunteers (CONT). Forty-four calculated ratios based on the abovementioned metabolites were also included using MS/MS quantification results.
Results
This pilot study led to the findings of 65 significantly changed amino acids, acylcarnitines, and some of their ratios for the LC, LD, and CONT groups. Among the differential parameters, 12 items showed reverse changing trends between the LC and LD groups compared to the CONT group. Regression analysis demonstrated that six of them – Arg, Pro, C10:1, Arg/Orn, Cit/Arg, and C5-OH/C0 – could be used to diagnose LC with a sensitivity of 91.3% and a specificity of 92.7%.
Conclusion
This study demonstrated the DBS-based MS/MS strategy was a promising tool for the discovery of tumor metabolite markers. Remarkably, this MS/MS analysis could be finished in several minutes, implying that it was a proper measure complementary to the traditional serum protein biomarker quantitation strategy for cancerous disease diagnosis and screening purposes.Keywords: lung cancer, mass spectrometry, newborn screening testsGo to:
Introduction
Newborn screening (NBS) helps in the early detection of inborn errors of metabolism (IEM). IEM consists of a group of metabolic disorders manifested by varied types of abnormal accumulation or deficiency of carbohydrates, amino acids, nucleic acids, steroids, and metals. Every IEM has its specific genetic deficiency and ~1,000 IEM mechanisms have been disclosed to date. These genetic abnormalities usually affect the structure of certain enzymes, availability of enzyme-specific cofactors, or biological processing of the enzymes. The typical pathological features of IEM include upstream substrate accumulation, downstream product shortage, or secondary metabolic byproduct overgeneration.1 It was estimated that the average morbidity due to IEM was ~1/4,000 in newborns.2
Tumor cells are transformed cells that evolve from normal cells. Genetic mutations can be found in nearly all tumor cells, although a single type of cancer can own different mutations or vice versa.3 The theory of “Warburg effect” demonstrates that cancer cells show distinct metabolic features compared to their normal counterparts. As observed in IEM, many metabolites are found to be abnormally accumulated and/or decreased in tumor tissues. For example, higher concentrations of blood branched-chain amino acids (BCAAs) are the pathological factors of maple syrup urine disease, a typical IEM. Recently, it was found that hepatocellular carcinoma and pancreatic adenocarcinoma were also linked to elevated blood BCAAs.4,5 Medium-chain acyl-CoA dehydrogenase (MCAD) deficiency will result in a series of IEM diseases characterized by abnormal organic acid metabolism, whereas dysregulated MCADs could be found in lung and hepatic cancers.6,7 Some IEM diseases are caused by secondary metabolite overproduction. For instance, phenylketonuria is due to the deficiency of phenylalanine hydroxylase. In this condition, phenylalanine is excessively converted into phenylpyruvate through an alternative pathway. Cancer cells can also transform normal substrates to uncommon byproducts. This can be demonstrated by the fact that malignant cells carrying isocitrate dehydrogenase mutations can catalyze isocitrate, on a large scale, to α-hydroxyglutarate instead of α-ketoglutarate.8 Furthermore, a body of evidence has shown that patients suffering from IEM diseases are susceptible to tumorigenesis.9 In this light, metabolic disorders are the common features of both IEM and cancerous diseases, implying the possibility that IEM screening measures could be, to some extent, used for cancer diagnosis purposes.
Tandem mass spectrometry (MS/MS) technology was first introduced into NBS in 1990.10 It plays key roles in IEM detection for its simultaneous multiple metabolite quantitation property. A single MS/MS run could be finished within 2–3 minutes, exhibiting great potential for high-throughput screening utilization.10 Currently, many countries have recommended MS/MS as one of the standard NBS techniques.11,12 The most popular sample type for NBS is the so-called dried blood spot (DBS) specimen. The notion of collecting blood samples for biochemical analysis on filter paper was first described by Ivar Christian Bang nearly a century ago.13 Subsequently, this method gained wide applications in clinical laboratories and was proved to be an effective and economic way of sampling blood. The distinct advantages of DBS sampling are 1) less blood volume is needed compared to the traditional venous blood sampling, which is often not compatible with pediatric patients; 2) sampling equipment is easy to operate and no expensive vacuum tube is needed; and 3) DBS can be stored for a long time using limited space with nearly no analyte degradation.13
Lung cancer (LC) is one of the lethal malignancies worldwide and has become the leading cause of cancer-related death globally. It was estimated that ~1.6 million cases were diagnosed and resulted in 1.4 million deaths in 2008.14 The prevailing diagnosis measures for LC in clinics include protein biomarker quantification, radiologic imaging, sputum cytology, and endoscopic examination. Of note, their sensitivities and specificities are not fully satisfied. In a study, it was found that 75% of the patients were diagnosed at later stages of disease, impairing the selection of effective therapeutic interventions and resulting in a 5-year survival rate of only 5%–10%.15 Taking LC as an example, this study would employ the popular NBS strategy, DBS-based MS/MS analysis, to test whether it could be used for LC diagnosis. The targeted analytes in this study included 26 acylcarnitines and 23 amino acids which are commonly used in IEM screening.16 These metabolites can reflect the systemic status of amino acid and fatty acid metabolism, and pathological changes associated with them are frequently encountered in most tumors including LC. In order to facilitate locking specific enzymatic activity fluctuation and enrich the data information, 44 calculated ratios based on the abovementioned metabolites were also included (our recently published results).Go to:
Materials and methods
Clinical samples
For this study, 222 LC patients, 118 benign lung disease (LD) patients, and 96 healthy volunteers (CONT) were enrolled from the First Affiliated Hospital of Liaoning Medical University. The LC patients with non-small-cell lung cancer (NSCLC) included those with adenocarcinoma (n=47), squamous carcinoma (n=103), adenosquamous carcinoma (n=49), and carcinoids (n=6). There were 17 small-cell lung cancer (SCLC) patients. Detailed information is given in Table 1. Before the study, written informed consents were acquired from the patients. The whole study was approved by the Hospital Ethics Committee of the First Affiliated Hospital of Liaoning Medical University and carried out in accordance with the Guidelines of the Hospital Ethics Committee of the First Affiliated Hospital of Liaoning Medical University. None of the LC patients had received chemotherapy or radiation treatment before sample collection. Every fasting blood DBS sample was collected from the tip of the distal phalanx of the third finger. The first drop of blood was discarded. The subsequent naturally formed blood drops were separately spotted onto the aseptic filter paper without the fingertip touching the paper surface. After drying at room temperature overnight, the sample paper was stored at −20°C in an airtight plastic bag individually. Then, 80% samples of each group were randomly selected as the training set to find differential metabolites and construct a regression model. The remaining 20% samples of each group were used for model validation purpose.
Table 1
Information of the patients and the healthy controls
HPLC-grade acetonitrile (ACN), methanol, and pure water used for the experiments were all the products of Thermo Fisher Scientific (Waltham, MA, USA). 1-Butanol and acetyl chloride were provided by Sigma-Aldrich Co. (St Louis, MO, USA). Internal standard kits containing 12 isotope-labeled amino acids (catalog number: NSK-A) and eight acylcarnitines (catalog number: NSK-B) were used for absolute quantification purposes. They all were purchased from Cambridge Isotope Laboratories (Andover, MA, USA). The standards were separately dissolved in every 1 mL of pure methanol and then mixed together to construct a stock solution and stored at 4°C. Working solution was prepared by diluting the stock solution 100 times. For quality control (QC) purposes, kits containing mixed standard amino acids and acylcarnitines were purchased from Chromsystems (Grafelfing, Germany). The QC samples were processed as real samples and randomly inserted in the real sample analysis queue.
Sample preparation
A blood spot disc with a diameter of 3 mm (~3.2 μL of whole blood) from each filter was punched out. The disc was placed in a well of a Millipore MultiScreen HV 96-well plate (Merck KGaA, Darmstadt, Germany) containing 100 μL of freshly prepared working solution. The disc-containing plate was gently shaken for 20 minutes at room temperature to release metabolites from the filter discs. For each plate, at least four low-level and high-level QC solutions were added into randomly selected empty wells. The QC samples were analyzed in parallel with the real samples to ensure the stability of the analysis. Subsequently, the disc-containing plate was centrifuged at 1,500× g for 2 minutes to collect the filtrate into a new flat-bottom 96-well plate installed below the disc-containing plate. The filtrate was dried by pure nitrogen gas (50°C). For each well, 60 μL of 1-butanol and acetyl chloride mixture (90:10, v/v) was added and incubated at 65°C for 20 minutes for metabolite derivatization. After a second drying procedure by nitrogen gas, 100 μL of mobile phase solution was added into each well to redissolve the derivatized metabolites.
MS/MS analysis
For metabolite MS/MS analysis, an AB SCIEX 4000 QTrap system (Framingham, MA, USA) equipped with an electrospray ionization (ESI) source was employed in positive scan mode. For each analysis, 20 μL of redissolved solution was injected, and 80% ACN aqueous solution was used as mobile phase with an initial flow rate of 0.18 mL/min. When the sample was introduced into the MS system for 8 seconds, the flow rate immediately decreased to 0.02 mL/min within 2 seconds and remained constant for 0.07 minutes. Subsequently, the flow rate increased to 0.6 mL/min within 0.5 minutes and remained constant for another 0.5 minutes. After that, the flow rate returned to 0.18 mL/min for equilibration. The total runtime was 2 minutes for each single run. A 4.5 kV ion spray voltage was applied to the MS system. Pressures for ion source gas 1, Ion Source Gas 2, and curtain gas were 35, 35, and 20 psi, respectively. Auxiliary gas temperature was maintained at 350°C. The scan parameters for the considered metabolites were identical to our previous report.16 MS/MS data were collected by using Analyst v1.6.0 (AB SCIEX). ChemoView 2.0.2 software (AB SCIEX) was used for absolute quantification purposes.
MS/MS data analysis
For the analysis, 80% of randomly selected raw quantitation data from each group were fed to SIMCA-P v11.5 software (Umetrics AB, Umea, Sweden) for partial least squares-discriminant analysis (PLS-DA) to find the difference among the groups. Potential metabolite markers were first selected based on the algorithm of significant analysis of microarrays (SAM)17 and then confirmed by one-way analysis of variance (ANOVA) or Student’s t-test (P<0.05 is considered significant). Metabolites showed reverse changing trends between the LC and LD groups compared to the CONT group subjected to binary logistic regression analysis to construct a diagnosis model. The diagnostic ability of the model was evaluated by the area under the receiver operating characteristic (ROC) curve (AUC). The diagnosis accuracy of this regression model was further validated by the remaining 20% samples from each group. All statistical analyses were conducted by using MINITAB v16.0 software (State College, PA, USA).Go to:
Results
QC sample data were first evaluated to ensure methodological applicability. All the QC values fell within the recommended ±2 standard deviation (SD) ranges (data not shown). This indicated that the adopted NBS tactic was stable and could be used to analyze real samples. For different LC types, the detected parameters showed no difference. This might be due to the fact that the parameters selected in this study could only reflect the general features of LC, or that the included patient numbers of different types were not sufficient enough to show subtype difference. PLS-DA was then used to differentiate the LC, LD, and CONT groups. It gave a relatively clear separation between the LC and non-LC (LD and CONT) groups (Figure 1A). A validation test based on 100 permutations indicated that no overfitting occurred in the analysis with the intercepts of R2=0.086 and Q2=−0.231 (Figure 1B).18 Evidently, Figure 1A shows a complete overlap between the LD and CONT groups, indicating that benign lung diseases did not cause substantial metabolic changes as malignant lung diseases.
Notes: (A) The score plot based on the first two calculated components after PLS-DA of the detected metabolites. (B) Validation of the PLS-DA model by showing the intercepts of R2 and Q2.
In the next step, SAM analysis was carried out to select the differentially changed metabolites and calculated ratios among the three groups. It was shown that the blood levels of 65 parameters were different at least between two randomly selected groups (Figure S1). Further analyzed by one-way ANOVA, all the 65 parameters changed significantly (P<0.05) as presented in the heat map (Figure 2).
To further investigate whether the adopted method could facilitate LC diagnosis, the data shown in Figure 2 were explored to find the parameters that showed reverse changing trends between the LC and LD groups as compared to the CONT group. The results showed that 12 parameters showed reverse changing trends. They included nine endogenous metabolites and three calculated ratios (Figure 3). Compared to the CONT group, Pro, C12, C14, C14:1, and Cit/Arg levels were elevated in the LC group but decreased in the LD group. On the contrary, Arg, Hcy, Pip, Arg/Orn, C5-OH/C0, and C10:1 levels were decreased in the LC group and increased in the LD group. These results indicate that benign lung diseases would result in some reversible metabolic changes as compared to those of the malignant lung diseases.
In the context of clinical utilization, these 12 parameters were further processed through a binary logistic regression analysis to establish a model for malignant and nonmalignant disease diagnosis. The final model included six parameters: Arg, Pro, C10:1, Arg/Orn, Cit/Arg, and C5-OH/C0 (P<0.05). ROC curve analysis indicated that diagnosis with a sensitivity of 91.3% and a specificity of 92.7% could be obtained if an optimal cutoff value of 0.766 was selected (Figure 4). The AUC was 0.967, indicating that this statistic model was robust for diagnostic purpose. On evaluation by another set of samples, the diagnosis accuracy of this regression model was 91.9% (68/74, with a sensitivity of 92.5% and a specificity of 91.2%). This diagnosis ability was comparable to that obtained by the combined use of routine multiple protein tumor markers for LC diagnosis.14Figure 4
ROC curve analysis of the regression model based on the parameters of Arg, Pro, Arg/Orn and Cit/Arg.
Notes: The final regression equation was: y=3.791–0.095×Arg–0.005×Pro+2.137×Arg/Orn+0.354×Cit/Arg–179.502×C5-OH/C0–12.652×C10:1. The dashed lines indicate the 95% confidence interval. The solid line represents the mean level.
Abbreviation: ROC, receiver operating characteristic.Go to:
Discussion
The search for new tumor markers has become a hot spot in all cancerous diseases including LC. Low-dose computed tomography could result in over 90% false-positive rates for LC diagnosis.14 The other strategies used were either with low sensitivity or with low specificity.14 One of the first used tumor markers for LC diagnosis is carcinoembryonic antigen (CEA). But, extremely elevated CEA levels could only account for 40%–80% of LC patients. It is most valuable as a prognostic marker rather than a diagnosis marker when used independently.19 Neuron-specific enolase (NSE) is another commonly used LC marker. Approximately, 40%–70% of LC patients, especially those suffering from SCLC, could have higher blood NSE levels. Approximately, 11%–41% of non-SCLC patients could be detected with elevated serum NSE levels. Similar to CEA, NSE tends to be used as a prognostic marker.19 The other markers include tissue polypeptide antigen and squamous cell carcinoma-related antigen. All of them are not sensitive enough and lack the specificity for LC if used individually. A recent report showed that combined use of different serum tumor biomarkers could improve LC diagnosis sensitivity and/or specificity.14 Remarkably, quantitation of these multiple serum protein markers is not cost-effective. What makes things worse is that nearly all the currently used LC biomarkers can elevate in benign lung diseases separately or collectively.14
Through sequential statistical analysis, at least 65 parameters were found to be differently expressed in the three groups (Figure 2). We speculated that benign lung diseases are characterized by reversible metabolic changes, but malignant lung diseases are the result of substantial irreversible metabolic remodeling.20 In order to avoid interference from the benign lung diseases, attention was paid to screening parameters that changed reversibly between the LC and LD groups as compared to the CONT group. Finally, 12 parameters were locked (Figure 3). Further filtered by regression analysis, the remaining six parameters could be sufficiently utilized for LC diagnosis purposes.
Increased blood Pro concentration has been found in various tumors.21,22 Pro is the only secondary amino acid involved in protein synthesis, and shows distinct biological functions compared to other primary amino acids.23 It plays significant roles in maintaining cancer cell proliferation and invasion and is also an anti-stress agent.24 Pro can be synthesized from Arg. The decreased concentrations of Arg in LC (Figure 3) might be due to its excessive conversion into Pro. For Pro synthesis, Arg should be first converted into Orn, which mainly takes place in the urea cycle. In the LC group, blood Arg/Orn was lower than that of the normal people. This evidence might partially explain the abovementioned deduction.23 Decreased Cit/Arg ratios were reported in interferon-α-treated cancer patients.25 Thus, this study implied that urea cycle intermediates play key roles in LC progression.
Acylcartinine-related parameters included in the regression model were also decreased in the LC group but increased in the LD group (Figure 3). Most of them were medium-and long-chain acylcarnitines, indicating the compromised mitochondrial β-oxidation functions. Impaired mitochondrial function is a universal pathological feature in nearly all tumors. A previous report also indicated that decreased medium- and long-chain acylcarnitines could be found in the urine of non-SCLC patients,26 whereas the exact biological significance is still elusive.Go to:
Conclusion
In this study, the DBS-based MS/MS NBS strategy was successfully used to assist in LC diagnosis. Combining six parameters, a regression model was constructed to realize accurate diagnosis of LC, which was comparable to the integrated utilization of some traditional serum protein biomarkers. Further analysis will focus on the integrated use of protein and metabolite markers to improve LC diagnosis accuracy. The employed MS/MS analysis could be completed in 2–3 minutes and was compatible with screening purposes. The cost to perform the MS/MS analysis is just similar to one tumor protein marker detection by immunochemiluminometric analysis, which meant that it was a cost-effective method for screening purposes. Here, only LC was selected as an example. It can be expected that this MS/MS analysis can be applied to explore the potential of metabolite markers for the diagnosis of other cancerous diseases.Go to:
Supplementary material
Figure S1
SAM analysis of the tandem mass spectrometry (MS/MS) data to screen the significantly changed parameters.Click here to view.(93K, tif)Go to:
Acknowledgments
This study was partially supported by the project from the Science and Technology Department of Liaoning Province.Go to:
Footnotes
Disclosure
The authors report no conflicts of interest in this work.Go to:
References
1. Lanpher B, Brunetti-Pierri N, Lee B. Inborn errors of metabolism: the flux from Mendelian to complex diseases. Nat Rev Genet. 2006;7(6):449–460. [PubMed] [Google Scholar]2. Zytkovicz TH, Fitzgerald EF, Marsden D, et al. Tandem mass spectrometric analysis for amino, organic, and fatty acid disorders in newborn dried blood spots: a two-year summary from the New England Newborn Screening Program. Clin Chem. 2001;47(11):1945–1955. [PubMed] [Google Scholar]3. Duesberg P, Mandrioli D, McCormack A, et al. Is carcinogenesis a form of speciation? Cell Cycle. 2011;10(13):2100–2114. [PubMed] [Google Scholar]4. Burrage LC, Nagamani SC, Campeau M, et al. Branched-chain amino acid metabolism: from rare Mendelian diseases to more common disorders. Hum Mol Genet. 2014;23(R1):R1–R8. [PMC free article] [PubMed] [Google Scholar]5. Mayers JR, Wu C, Clish CB, et al. Elevation of circulating branched-chain amino acids is an early event in human pancreatic adenocarcinoma development. Nat Med. 2014;20(10):1193–1198. [PMC free article] [PubMed] [Google Scholar]6. Huang D, Li T, Li X, et al. HIF-1-mediated suppression of acyl-CoA dehydrogenases and fatty acid oxidation is critical for cancer progression. Cell Rep. 2014;8(6):1930–1942. [PubMed] [Google Scholar]7. Sohn EJ, Kim J, Hwang Y, et al. TGF-beta suppresses the expression of genes related to mitochondrial function in lung A549 cells. Cell Mol Biol. 2012;(Suppl 58):OL1763–OL1767. [PubMed] [Google Scholar]8. Parker SJ, Metallo CM. Metabolic consequences of oncogenic IDH mutations. Pharmacol Ther. 2015;152:54–62. [PMC free article] [PubMed] [Google Scholar]9. Onal IK, Turhan N, Oztas E, et al. Hepatocellular carcinoma in an adult patient with type IV glycogen storage disease. Acta Gastroenterol Belg. 2009;72(3):377–378. [PubMed] [Google Scholar]10. Millington DS, Kodo N, Norwood DL, et al. Tandem mass spectrometry: a new method for acylcarnitine profiling with potential for neonatal screening for inborn errors of metabolism. J Inherit Metab Dis. 1990;13(3):321–324. [PubMed] [Google Scholar]11. Pandor A, Eastham J, Chilcott J, et al. Economics of tandem mass spectrometry screening of neonatal inherited disorders. Int J Technol Assess Health Care. 2006;22(3):321–326. [PubMed] [Google Scholar]12. Pandor A, Eastham J, Beverley C, et al. Clinical effectiveness and cost-effectiveness of neonatal screening for inborn errors of metabolism using tandem mass spectrometry: a systematic review. Health Technol Assess. 2004;8(12):iii1–iii121. [PubMed] [Google Scholar]13. Gruner N, Stambouli O, Ross RS. Dried blood spots – preparing and processing for use in immunoassays and in molecular techniques. J Vis Exp. 2015;13(97):e52619. [PMC free article] [PubMed] [Google Scholar]14. Hirales Casillas CE, Flores Fernandez JM, Padilla CE, et al. Current status of circulating protein biomarkers to aid the early detection of lung cancer. Future Oncol. 2014;10(8):1501–1513. [PubMed] [Google Scholar]15. Spiro SG, Porter JC. Lung cancer – where are we today? Current advances in staging and nonsurgical treatment. Am J Respir Crit Care Med. 2002;166(9):1166–1196. [PubMed] [Google Scholar]16. Wang Q, Sun T, Cao Y, et al. A dried blood spot mass spectrometry metabolomic approach for rapid breast cancer detection. OncoTargets and Therapy. 2016;9:1389–1398. [PMC free article] [PubMed] [Google Scholar]17. Tusher VG, Tibshirani R, Chu G. Significance analysis of microarrays applied to the ionizing radiation response. Proc Natl Acad Sci U S A. 2001;98(9):5116–5121. [PMC free article] [PubMed] [Google Scholar]18. Huang Z, Lin L, Gao Y, et al. Bladder cancer determination via two urinary metabolites: a biomarker pattern approach. Mol Cell Proteomics. 2011;10(10):M111. [PMC free article] [PubMed] [Google Scholar]19. Ferrigno D, Buccheri G. Clinical applications of serum markers for lung cancer. Respir Med. 1995;89(9):587–597. [PubMed] [Google Scholar]20. Warburg O. On the origin of cancer cells. Science. 1956;123(3191):309–314. [PubMed] [Google Scholar]21. Catchpole G, Platzer A, Weikert C, et al. Metabolic profiling reveals key metabolic features of renal cell carcinoma. J Cell Mol Med. 2011;15(1):109–118. [PMC free article] [PubMed] [Google Scholar]22. Hirayama A, Kami K, Sugimoto M, et al. Quantitative metabolome profiling of colon and stomach cancer microenvironment by capillary electrophoresis time-of-flight mass spectrometry. Cancer Res. 2009;69(11):4918–4925. [PubMed] [Google Scholar]23. Phang JM, Pandhare J, Liu Y. The metabolism of proline as microenvironmental stress substrate. J Nutr. 2008;138(10):2008S–2015S. [PMC free article] [PubMed] [Google Scholar]24. Liu W, Glunde K, Bhujwalla ZM, et al. Proline oxidase promotes tumor cell survival in hypoxic tumor microenvironments. Cancer Res. 2012;72(14):3677–3686. [PMC free article] [PubMed] [Google Scholar]25. Fekkes D, Van Gool AR, Bannink M, et al. Nitric oxide production and monoamine oxidase activity in cancer patients during interferon-alpha therapy. Amino Acids. 2009;37(4):703–708. [PMC free article] [PubMed] [Google Scholar]26. Wu Q, Wang Y, Gu X, et al. Urinary metabolomic study of non-small cell lung carcinoma based on ultra high performance liquid chromatography coupled with quadrupole time-of-flight mass spectrometry. J Sep Sci. 2014;37(14):1728–1735. [PubMed] [Google Scholar]
Articles from OncoTargets and therapy are provided here courtesy of Dove Press
Toxicology is a multidisciplinary study of poisons, aimed to correlate the quantitative and qualitative relationships between poisons and their physiological and behavioural effects in living systems. Other key aspects of toxicology focus on elucidation of the mechanisms of action of poisons and development of remedies and treatment plans for associated toxic effects. In these endeavours, Mass spectrometry (MS) has become a powerful analytical technique with a wide range of application used in the Toxicological analysis of drugs, poisons, and metabolites of both. To date, MS applications have permeated all fields of toxicology which include; environmental, clinical, and forensic toxicology. While many different analytical applications are used in these fields, MS and its hyphenated applications such as; gas chromatography MS (GC-MS), liquid chromatography MS (LC-MS), inductively coupled plasma ionization MS (ICP-MS), tandem mass spectrometry (MS/MS and MSn) have emerged as powerful tools used in toxicology laboratories. This review will focus on these hyphenated MS technologies and their applications for toxicology.Key words: Environmental toxicology, clinical toxicology, forensic toxicology, mass spectrometry technologiesGo to:
INTRODUCTION
Toxicology can be thought of as the study of poisons, how poisonous encounters occur, how individuals respond to these encounters, and how to develop strategies for the clinical management of toxic exposures1. Poisons can be broadly defined as biologically active substances causing toxic effects in living systems. In essence, any biologically active molecule capable of altering normal physiology within a living system becomes a poison upon accumulation to quantities sufficient for a toxic effect1. For this reason, even therapeutic remedies can become poisons and toxic effects depend not only on the dose, but also on the overall pharmacokinetic and pharmacodynamic effects2.
Since we are constantly surrounded by various chemicals, exposure can occur at home, work, or from the environment. The sheer complexity of possible poisons requires the use of sophisticated analytical tools and techniques to evaluate toxic exposures3-6. Toxic evaluations usually begin with qualitative or quantitative assessment in order to identify and/or quantify a toxic substance that could account for observed toxic syndromes (toxidromes) which are characteristic of different classes of poisons7. In addition, identification of the source for toxic exposures is equally important. However, the overall role of laboratory testing is to identify and confirm the presence of a suspected poison and also to provide prognostic information when test results are able to predict clinical outcomes and/or help guide patient management.
In toxicology, the general analytical scheme for assessment of poisons in various matrices involves; 1) extraction, 2) purification 3) detection and 4) quantification (Scheme 1, A)8. The rise of modern analytical tools used by toxicology laboratories seems to have coincided with the chemical/industrial revolution (roughly 1850’s to 1950’s). A time which saw development of new liquid-liquid and solid-phase extraction methods along with qualitative or quantitative methods of detecting poisons based on their physical characteristics8,9. By the early twentieth century, chromatographic techniques using differential migration processes for separation of target molecules were developed by Mikhail Tsvet9 and with the first versions of modern separation techniques such as liquid chromatography (LC) and gas-liquid chromatography (GLC or simply gas chromatography, GC) became routine in both analytical and preparative applications by mid-20th century1,10,11. At this time, labs also started to see the development of the first versions of modern mass spectrometers being used primarily for analysis of relatively pure materials11-12.Scheme 1
The analytical process for toxic compound evaluation in toxicology
As MS, GC and LC technologies continued to advance in the second half of the 20th century, the more sophisticated methods used in modern toxicology laboratories started to emerge as amalgamations of separation and detection modes, creating new powerful analytical applications.
These included; high pressure liquid chromatography (HPLC), GC-MS, LC-MS, MS/MS and MSn. These new technologies were initially used by research laboratories and later adopted into clinical laboratories11,13. To date, many of the modern analytical applications such as GC-MS and LC-MS still incorporate the same analytical scheme used by the earliest toxicology laboratories. But they are more stream-lined by combining multiple steps in the process with potential for automation (Scheme 1, B). This review will highlight current MS applications for Toxicology.
Mass spectrometry
Mass spectrometry is a quantitative technique which determines the mass-to-charge (m/z) ratio. In general, a mass spectrometer can be divided into four main components (Scheme 1, B): 1) a sample inlet, 2) an ion source, 3) a mass analyzer, and 4) a detector. The sample inlet is where the sample enters the instrument before reaching the ion source. Ion sources are generally distinguished based on their underlining ionization technique11,12. The ionization technique used will determine the type of sample (e.g solid, liquid, vs gaseous samples) that can be analyzed in a given instrument and therefore also the type of chromatographic separation technique that should be coupled to the MS. Furthermore, the efficiency of sample ionization also determines in part the instrument’s analytical sensitivity11,12. MS instruments in toxicology laboratories generally have LC or GC front ends, feeding into the instrument inlet either a liquid or gaseous sample for downstream ionization, analysis, detection, and quantitation (Figure 1, A-C)3,4.Figure 1
Simple representation of A) GC-MS; B) LC-MS; and C) ICP-MS instruments and the ionization process for EI, ESI, and ICP occurring prior to mass analysis and detection in the mass spectrometer
Common ionization techniques used by GC-MS include; electron ionization (EI) and chemical ionization (CI) for analysis of volatile and heat stable compounds (Figure 1A, GC-MS)11. For LC-MS, Atmospheric pressure ionization techniques (API) such as; electrospray ionization (ESI) and atmospheric pressure chemical ionization (APCI) are used for non-volatile and heat labile compounds (Figure 1B, LC-MS). Inductively coupled plasma ionization (ICP) is another ionization method used for elemental analysis usually for metals determination using ICP-MS (Figure 1C, ICP-MS) and matrix assisted laser desorption ionization (MALDI) for ionization of solid samples for MS analysis. Since MALDI techniques are not commonly used in toxicology applications, these won’t be discussed in much detail here. Furthermore, the focus will be on the more prevalent EI, ESI and ICP ionization techniques used for toxicology applications despite the fact that modern GC-MS and LC-MS instruments can usually switch between EI/CI and ESI/APCI ionization mechanisms, respectively4,5,11.
Mass analyzers and MS performance
From the ion source, sample ions enter the mass analyzer. Mass analyzers are the heart of the instrument and determine key performance characteristics such as the instrument’s mass resolution, accuracy, and range. The mass range is the analytical mass range of the instrument. The resolution determines the ability of the analyzer to resolve two adjacent masses on the mass spectrum and is defined by the full width of the mass peak at half height of the peak maximum (FWHM). For a given m/z value, the resolution can be expressed as a ratio of m/z to FWHM such that for an ion with m/z 1000 and peak width of 0.65 atomic mass unit (amu) at FWHM the resolution is 1538. Low resolution instruments have FWHM > 0.65 amu and high resolution instruments reaching FWHM < 0.1 amu. The mass accuracy of MS instrument refers to the error associated with a particular m/z measurement. High mass accuracy gives the ability to measure the true mass of an ion to more decimal points. For example if the true mass of target ion is 1000 m/z and the measured mass from the instrument is 1000.002 m/z. The mass accuracy can be expressed in parts per million based on the ratio of the difference between the true mass and the measured mass to that of the true mass. So a ratio of 0.002/1000 which equals 0.000002 or a mass accuracy of 2 ppm in this example.
Mass analyzers typically used in toxicology include; quadrupole, ion traps, time of flight (TOF) and sector4,11,15,16. Quadrupole analyzers use four parallel metal rods to create a variable electromagnetic field which allows ions within a particular m/z range to reach the detector in order to record the mass spectrum. Quadrupole analyzers are cheap and robust, but can typically only achieve resolution around 1000 and mass accuracies of 100 ppm16.
Ion trap (IT) instruments include quadrupole ion traps (QIT), Fourier Transform Ion Cyclotron Resonance (FT-ICR) and orbitraps. QIT use 2D or 3D quadrupole fields to trap target ions in a confined space and the mass spectrum is acquired by scanning the radion frequency (RF) and direct current (DC) fields to eject selected ions for detection11,12. Resolution for QIT is about 1000 – 10,000 with mass accuracy > 50 ppm16. FT-ICR are ion trap that keep ions in cyclotron motion within the trap. m/z detection occurs through measurement of induced currents from changes in ion orbits when an RF field is applied. This, allows calculation of m/z values with high accuracy (resolution > 200,000 and accuracy 2-5 ppm)11,12,16. Orbitraps use a metal barrel to create an electrostatic field for trapping ions in cyclical motion. The detection method is similar to that use in FT-ICR traps but with lower resolution < 150,000 but similar mass accuracy to FT-ICR16.
TOF mass analyzers use a fixed potential to accelerate ions through a drift tube. Since all ions in a given pulse will attain the same kinetic energy, ions accelerate according to their m/z value and the mass spectrum is collected based on the time it takes individual ions to strike the detector. TOF analyzers generally have a higher mass range than quadrupole and IT instruments with relatively high resolution (1000 – 40,000) and mass accuracy (> 5 ppm)16.
Sector analyzers are either magnetic sectors or double focusing (magnetic and electric) sectors. Similar to a TOF analyzer, magnetic sectors use a fixed potential to accelerate ions coming from the source such that ions attain the same kinetic energy but different momentum according to their m/z16. Accelerated ions are then passed through a magnetic field which guides ions through an arched path in order to strike the detector according to their momentum to charge ratio. By scanning the magnetic field strength, ions with different m/z are selected for detection. In magnetic sectors, resolution is limited by minor kinetic energy dispersions (ion velocities). A double focusing sector analyzer adds a electric field before or after the magnetic field to also focus ions according to their kinetic energy to charge ratios. Focusing ions of different velocities to the same point. This gives double focusing magnetic sectors relatively high resolution (100,000) and high mass accuracy (<1 ppm)16.
In summary, the ion source, mass analyzer, and detector for a particular instrument all play a role in defining the instrument’s analytical capabilities. It is also important to note that even though the basic design of MS instruments has stayed relatively unchanged over time, the performance capabilities of MS sources, analyzers, and detectors have continued to improve over time4,11,13,15. The strength of MS for Toxicology is the combined sensitivity and specificity that is needed to identify and quantify the toxic agents.
MS instruments
The versatility of MS analytical applications comes from the ability to couple different separation techniques in the front-end (i.e. GC or LC) and various analyzers either in tandem or hybrid configurations4,5,11,12,15. The type and arrangement in a given instrument not only determines its resolution, mass accuracy, and analytical range, but also the type of experiment(s) possible for analytical applications (Figure 2, A-E)4,11,13,15. In clinical applications, the MS instrument with most versatile capabilities is perhaps the triple quadrupole tandem mass spectrometer or TQ-MS/MS with three quadrupole analyzers arranged in tandem for MS/MS experiments13. The first quadrupole (Q1) selects ions that will enter the second quadrupole (Q2), a collision cell able to carry out collision induced dissociation (CID) of selected ions. From the collision cell, product ions enter the third quadrupole (Q3) which can guide selected ions into the detector. TQ-MS/MS instruments are capable of performing full MS scans (FS, Figure 2A), multiple reaction monitoring (MRM, Figure 2, B-E), or single reaction monitoring (SRM, not shown) for analyte detection13,3.Figure 2
Analytical experiments possible with a TQ-MS/MS instrument
The MS/MS experiment involves selected fragmentation of target ions using CID followed by analysis of the products (Figure 2B, product ion scan)13. The target ion is often referred to as parent ion and CID fragments are referred to as product ions. In MS/MS experiments, MRM will follow the conversion of one parent ion to one product ion via CID (indicated as parent m/z > product m/z) or any experimentally feasible combination of parent and product ions given analytical capabilities of the instrument. MRM and SRM usually increases sensitivity based on improved signal to noise ratio, and the MS/MS offers increased specificity at the cost of decreased sensitivity since signal is lost at each round of fragmentation. Specificity improves when unique fragmentation patterns are able to distinguish co-eluting ions with identical exact mass as targeted molecule, but different chemical composition. In addition, MS/MS can also be used for structural determinations. A key advantage of the TQ-MS/MS instrument is the ability to do precursor ion scan (PI, Figure 3C) or neutral loss (NL, Figure 3D) reaction scans over a wide m/z range4,11,13,15. This application can use a single sample injection for rapid scanning of the full m/z spectrum in order to identify compounds with known functional groups that dissociate as detectable ions or neutral masses following CID.
Due to the tandem arrangement of quadrupole analyzers in the TQ-MS/MS, MS/MS is done sequentially in space between different analyzers. In IT instruments (QIT, Fourier transform ion trap or FT-IT, and orbitrap), MS/MS experiments are done in sequence over time based on the ability of the trap to retain selected ions following each round of CID4,11. MS/MS also occurs with high efficiency in IT instruments but one key limitation is the capacity to retain ions and m/z scanning speed4,11. 2D ion traps were designed to overcome the ion capacity problem and have a higher analytical range giving FS, SRM, and MRM capabilities over a wider m/z range compared to 3D ion traps4,11. The in-time MS/MS application of IT instruments means PI and NL screening experiments are not possible. However, MSn experiments for structural determination of larger molecules are possible, usually with no more than three rounds of fragmentation due to loss of signal following each consecutive round of CID4.
Over time, MS instruments have continued to improve in selectivity, mass accuracy, and resolution, along with formation of hybrid instruments with enhanced capabilities often designed to overcome limitations of available instrumentation. For example, one key limitation of TQ-MS/MS instruments is that the PI/NL scans cannot be performed in a single injection along with MS/MS acquisitions for targeted structural determination. The QTRAP is a hybrid TQ-IT instrument where the third quadruple is a linear IT, making possible the acquisition of PI, NL, and MSn experiments in a single injection4,11. Other hybrid instruments are designed to couple more accurate mass determination with MS/MS or MSn capabilities like the hybrid quadrupole time-of-flight (QTOF) instrument or quadrupole-orbitrap hybrid (QE or Q Exactive).Go to:
MS APPLICATIONS FOR TOXICOLOGY
To date, MS and its hyphenated applications (GC/LC/ICP-MS) have emerged as a powerful analytical tool for toxicology applications. GC-MS is generally used for analysis of volatile and heat stabile compounds, LC-MS for analysis of non-volatile and heat labile compounds, and ICP-MS for elemental analysis usually in metals determination4,5,11,13,14,17. Owing to the analytical versatility of MS methods with exceptional specificity, sensitivity, dynamic range, and the ability to screen large numbers of unrelated compounds, MS applications are central for toxicological analysis of drugs and poisons. Current use includes drug analysis for targeted applications (e.g. in TDM and pain management), screening applications (e.g. in drugs of abuse (DOA), forensic toxicology, environmental toxicology, and clinical toxicology), and in pharmacokinetic/pharmacodynamics (PK/PD) research5,11,14,15,17,18. Here, we will focus on GC-MS, LC-MS, ICP-MS, and MS/MS capabilities and respective applications for toxicology.
Overcoming limitations of Immunoassays (IA) in TDM and drug screens
Since MS applications emerged at a time where IAs were already established in clinical laboratories, one driving force for the expansion of GC and LC-MS application in Toxicology has been efforts to overcome the limitations of IAs in drug analysis13,19-22. One limitation is IA are usually developed by manufacturers who seek FDA test approval based on commercial interests, with the end user having little control over this process. Another limitation is poor analytical specificity and analytical interferences13,19-22. The specificity of IA’s developed for small drugs is usually limited to the detection of drug classes, but not necessarily individual drugs within a given drug class. This limitation could stem from the fact that antibodies generally recognize epitopes on large biomolecules, making the specificity of IAs poor for recognizing specific small molecules13,22. Currently, IA’s are often used in first line screening for Toxicology since they can quickly identify a potentially negative sample, and are useful in identifying drug classes or specific drugs (i.e. benzodiazepines, opiates, amphetamines, cannabinoids, methadone, fentanyl, and phencyclidine), but suffer from high rates of false positive and false negative results due to a lack of specificity, cross reactivity, or interferences4,21. Since immunoassays are generally available as FDA approved tests on large automated analyzers, the common approach is to screen using an immunoassay first and then confirm positive results using GC-MS or LC-MS techniques which have superior sensitivity and specificity to identify specific molecules4,21.
Drug analysis by GC-MS
Coupling of GC to MS provided an opportunity for development of routine applications with the specificity and sensitivity of MS (Figure 1A)11,14,17,23. GC is an analytical separation technique using a liquid or polymer stationary phase along with a gas mobile phase for separation of molecules based on partitioning between the stationary and gas phase. The process usually requires high temperature or temperature gradients (up to 350°C) in order to facilitate compound elution into the mobile gas phase (Figure 2A). The analytes are separated based on their column retention time, entering the MS in the gas phase for ionization usually with EI sources to facilitate MS detection. EI ionization uses the kinetic energy from a stream of high energy electrons (usually 70 eV) to strip electrons from analyte molecules at high temperatures, a process that produces a reproducible fragmentation patter from organic compounds (Figure 2A)11. For this reason, EI-GC-MS data is conducive to inter-laboratory spectral comparisons and extensive EI-GC-MS libraries have been generated for spectral matching based identification11,23,24. These libraries supplement “in-house” generated libraries and greatly increasing the ability to identify unknown compounds using GC-MS. This analytical advantage has made EI-GC-MS a premier tool for untargeted detection and quantitation of small molecules with MS specificity. EI-GC-MS is still used for general unknown screening applications using nearly any sample type17,21,25. Additionally, GC-MS is commonly used to confirm IA positive results in drug screens in clinical toxicology4,18,22,23. One key limitation of GC-MS is the need to have volatile and heat stabile analytes, this means that some analytes require chemical derivatization in order to make the drugs sufficiently volatile for GC-MS analysis23,25. This limits GC-MS expansion to analysis of many drugs and adds additional steps and cost during sample preparation.
GC-MS applications for toxicology
GC-MS does have several advantages compared to its LC-MS/MS counterpart that include: efficient GC separation with higher chromatographic resolution and peak capacity, a homogeneous gas mobile phase (usually helium or hydrogen), optimization of separation conditions with precise electronic controls such as temperature programming, and the ability to search EI-MS databased for library based toxic compound identification11,24. Taken together with good MS sensitivity (1-10 µg/L) and specificity, a leading application of GC-MS is the general screening of unknown drugs or toxic compounds in doping control, environmental analysis, and clinical and forensic toxicology24.
Therefore, in clinical toxicology, GC-MS is commonly used for screening blood and urine for acute overdose of prescription and over the counter medications in emergency room settings. This is specifically useful for drugs with toxic effects and known antidotes or therapies that can be initiated to treat the toxic effect1,17,25. It is also commonly used to perform drug screens for identification and/or quantitation of poisons in the clinical evaluation of toxindromes or in forensic investigations. Drugs commonly quantitated by GC-MS include; barbiturates, narcotics, stimulants, anesthetics, anticonvulsants, antihistamines, anti-epileptic drugs, sedative hypnotics, and antihistamines24. In environmental toxicology, GC-MS is used for the convenient screening of a wide range of toxic compounds such as; chloro-phenols in water and soil or polycyclic aromatic hydrocarbons (PAH), dioxins, dibenzofurans, organo-chlorine pesticides, herbicides, phenols, halogenated pesticides, and sulphur analysis in air24. One thing to mentions is most toxicology laboratories which can afford it are slowly replacing GC-MS with LC-MS as the method of choice for targeted drug screens for clinical and forensic toxicology applications4,14,23. Lastly, the higher specificity of MS detection compared to enzymatic spectrophotometric assays, GC-MS is sometimes used for identification and quantitation volatile substances (e.g. ethanol, methanol, acetone, isopropanol, and ethylene glycol) in body fluids such as blood and urine.
LC-MS applications for drug analysis
Due to the limitation of GC-MS for analysis of volatile and heat stable compounds, LC-MS applications have expanded MS applications to the direct analysis of non-volatile and heat labile molecules in toxicology laboratories (Figure 2B)4,11,13,21,22,26. The coupling of MS to LC was first possible when API-ESI sources became available in the 1990s, making it possible to ionize samples in the condensed phase and inject ions directly for MS analysis11,12. In contrast to EI used in GC, ESI is a soft ionization technique which does not induce fragmentation, instead, singly or multiply charged ions form from intact molecules due to proton transfer events (Figure 2B)11,12. ESI uses a capillary tube to flow solvent through a voltage potential before the solvent is sprayed into the MS vacuum as an aerosol12. Under vacuum, a heated gas (e.g. N2) is used to dry the droplets and release gas phase ions for MS detection. The exact mechanism of ion formation by ESI is not fully understood, but the aerosol droplets are either negative or positively charged depending on the voltage applied and protonation/deprotonation events giving intact [M+H]+ or [M-H]– ions for MS analysis (Figure 2B)11,12. To date, there seems to be no limit to the size of molecule which can be ionized by ESI in biological samples12. Multiple protonation/deprotonation events also means ESI can yield more than one m/z peak from a single compound, a phenomenon that can either complicate the MS analysis or facilite measurements which improve precision or allow observation of m/z from targets with MW above the instrument range12. One inherent limitation of the ESI process, and therefore LC-MS, is the mass spectra of a given compound can vary depending on instrument conditions, including the capillary diameter, sample flow rate, and voltage applied4,23. The consequence is ESI mass spectra are instrument dependent, requiring the development of in-house derived spectral libraries for compound analysis23,26. Regardless, by overcoming key limitations of GC-MS, LC-MS has significantly expanded MS applications to targeted drug analysis of non-volatile and heat labile compounds such as drug metabolites11,13-15,26.
The switch form GC-MS to LC-MS for analysis of toxin and drug metabolites in toxicology is notable11,18,27-29. One reason for this is that most drugs or toxicants entering the body undergo biotransformation by phase I (functionalization) and phase II (conjugation with hydrophilic endogenous molecules) metabolic reactions in order to facilitate elimination from the body11,30. The transformations often result with structurally diverse hydrophilic and heat labile metabolites with biological activities ranging from no pharmacological activity, to pharmacologically activity, to toxicity15,23,29,30. The nature of these drug metabolites, especially phase II metabolites, gives LC-MS a unique advantage for analysis of drugs and their metabolites using LC-MS, MS/MS and MSn applications for identification, structural determination, and mapping PK/PD interactions during ADME30. To date, numerous studies have demonstrated that combined analysis of drug and metabolites greatly increases the ability to positively identify drug use using blood or urine samples25. Furthermore, urine has a much wider window of detection for detecting drug use, but extensive drug metabolism for urine excretion makes metabolite analysis more important for interpretation of results of urine drug analysis in pain management or DOA screening18,25. Lastly, LC-MS is also routinely used for targeted drug analysis in TDM, forensic toxicology, PK/PD pharmaceutical analysis, or in confirmation of compounds that do not work with GC-MS4,18,25,31.
ICP-MS applications for analysis of toxic metals
ICP-MS was introduced for clinical use in 1980’s for individual or multi-elemental metals analysis in toxicology5,32. The ICP source is designed for sample atomization and elemental analysis. Usually a peristaltic pump is used to inject aerosolized liquid samples into an argon plasma discharge at (5000-7000°C), but an LC can also be used for the separation of elements that require speciation (Figure 2C)33. The plasma vaporizes, atomizes, and effectively ionizes the sample for elemental analysis by MS. Advantages of LC-ICP-MS include the ability for metal speciation, multiple element measurements, and a wide dynamic range with accurate and precise trace metal measurements34,35. Detection limits for ICP-MS are commonly in the low ng/L range, giving an advantage in quantification of low levels of trace elements or toxic metals5,35.
A key limitation of ICP-MS applications for metals analysis is polyatomic interferences5,32,34. These are interferences that result from the combination of two (or more) atomic ions from the sample matrix to form molecules which have the same m/z with analytical targets. One example is the combination of the argon plasma gas (40 Da) with a chloride ion (35 Da) or carbon (12 Da) from the biological matrix to produce ArCl (75 Da) and ArC (52 Da) ions. ArCl and ArC have the same m/z as arsenic and chromium, two metals commonly incorporated into toxic metal surveys by ICP-MS5. To date, several ICP-MS applications have been developed in order to overcome isobaric or polyatomic interferences to improve specificity using collision/reactions cell applications. A dynamic reaction cell (DRC) uses a reactive gas in quadrupole ICP-MS instruments to overcome isobaric interferences from the plasma by reacting the gas with either the analyte (ion) of interest or isobaric compound (ion) in order to distinguish the two5. Equally, the quadrupole can act as a collision cell where a inert gas is introduced and will preferentially interact with polyatomic ions with larger radii, reducing their kinetic energy to allow resolution of polyatomic interferances from the analyte of interest through kinetic energy discrimination (KED). Lastly, collision induced dissociation (CID) in a triple quadrupole ICP-MS/MS can be used to break up polyatomic interferences prior to MS detection or a higher resolution instrument (e.g. double focusing sector ICP-MS) can be used to resolve polyatomic inteferences through accurate mass determination5. Owing to the high specificity, sensitivity, and reproducibility in elemental analysis by ICP-MS, this technique is now used in clinical laboratories for toxic metal and trace elements quantitation in a wide variety of samples, these include; whole blood, serum, plasma, urine and dry spots of these liquid samples (using laser ablation with ICP-MS). Sample collections in metal-free tubes are required for accurate determinations5,34,35. Other sample types used in forensic toxicology include; urine, hair, nail, tissue, and or other forensic materials.
Toxic metals and metal exposures
Metals represent some of the oldest toxicants known, with records of toxic metal exposures dating back to ancient times1. Nonetheless, many metals are also essential or trace elements with vital functions for life (i.e. cobalt, copper, iron, magnesium, selenium or zinc), but will become toxic with increased levels or pathologic metabolism like Cu in Wilson Disease (WD)5. Others like; thallium, arsenic, mercury, and lead, are poisons with no well-established physiological function. Other potentially toxic metals include: chromium, cadmium, platinum, nickel, aluminum, and gadolinium5. Metals exert their toxic effects through redox chemistry with biological targets, a process that might change the oxidation state of the metal and lead to formation of characteristic organometallic compounds5,36. Each metal has a specific mechanism of toxicity with different metal species varying in toxic effects. For this reason, metal speciation is an important aspect of clinical evaluations of toxic metal exposures36. Speciation involves identification and quantitation of different forms of a given chemical species. For example, chromiumVI (CrVI) is a powerful toxic oxidant whereas CrIII is less toxic and plays a role in metabolism5,36,. Elemental mercury (Hg°) has a lower toxicity than methyl mercury (MeHg), and arsenic is present in seafood as innocuous arsenocholine and arsenobetaine, but elemental arsenic is highly reactive and toxic to humans5,36. The different metal species can be distinguished through distinct; isotopic composition, oxidation state, or over-all molecular structure with speciationbeing essential in the-evaluation of some toxic metal exposures34-36. Speciation with LC-ICP-MS effectively relies on LC separation of various metal species followed by MS detection. To date, methods have been developed for speciation of Hg, Arsenic, Cr and other36.
Furthermore, isotopic fractionation by high resolution ICP-MS (HR-ICP-MS) or Q-ICP-MS can function as another method of metal identification. For example, lead isotopic ratios (206Pb, 207Pb, 208Pb) may be useful to confirm the source of metal exposure in clinical toxicology or in forensic toxicology5. Studies have also shown 65Cu/63Cu isotopes ratios in dried urine spots or serum can be used to classify treated and untreated Waldenstrom’s disease (WD) patients when isotopically enriched sampes are administered36-38. For this reason, ICP-MS is a powerful tool for evaluation of metal exposures in forensic and clinical investigations with the ability to also use isotopic analysis to confirm the source of lead contamination. These distinctions are important since anthropogenic activities have introduced toxic metals such as lead (from gasoline) into the environment (air, water, and soil), the workplace, and consumer products such as food and pharmaceuticals5,34-36. Furthermore, metals are also used in implants for joint replacement (e.g cobalt, chromium, and titanium) and may leach-out during wear of the prosthetic device leading to the endogenous accumulation with potentially toxic consequences36,39. For these reasons, ICP-MS screening and speciation assays for toxic metals are commonly developed in order to evaluate toxic exposures in clinical toxicology, lethal exposures in forensic toxicology, and investigate environmental sources of metal exposure.
ICP-MS applications in clinical toxicology
ICP-MS is extensively used in multi-analyte toxic metal screens in whole blood, plasma serum and urine5. Blood and urine analysis is generally useful in assessing acute and chronic metal exposure with reference values available to aid with result interpretation from several geographical locations around the world36. Newer applications using dried blood or urine spots along with laser ablation for multi analyte metal analysis have also been described38,40. The multi-analyte ICP-MS metal panels can include up to dozens of targets including; lead, mercury, arsenic, cobalt, chromium, manganese, molybdenum, nickel, titanium, aluminum, and silver5,36. Lead is commonly evaluated in children due to its adverse effects on development41. Exposures can also occur from buildings with old lead water pipes, lead containing paint, or exposure from environment accumulation due to historic use of gasoline with tetraethyl lead5,41. Mercury exposure can occur from eating carnivorous fish which tend to contain high MeHg content as it accumulates up the food chain from environmental contamination. Exposures to mineral mercury leaching from dental amalgams has also been described42. Mineral mercury is usually measured in plasma and MeHg in whole blood to distinguish exposures from seafood and dental amalgams5,36,42. Arsenic is a substance that has been used in intentional poisonings, but accidental exposure can also occur through contaminated ground water5,43. Toxic levels of cobalt, chromium, manganese, molybdenum, nickel and titanium have been shown in people with various metal replacement joints or dental implants5,39. Aluminum is routinely quantified in plasma to monitor hemodialysis patients and it is also the subject of toxicological controversies associated with adverse effects from vaccines5. Historically, silver has been used as an effective bactericide but when taken in excess, exposures can result with development of argyria along with neurologic, hematologic, renal, or hepatic involvement with blood silver toxic levels as reported from cases of argyria44-46.
ICP-MS applications in forensic toxicology
Deaths due to metal toxicity are uncommon and often unexpected, as a result, all unexplained deaths often prompt blood analysis for traditional metal poisons (e.g arsenic, thallium) toxic heavy metals (e.g arsenic, lead, cadmium, mercury) and other toxic metals (e.g aluminum, chromium, cobalt, molybdenum, nickel, vanadium or tungsten) or drugs (e.g contrast media). One advantage of forensic metals analysis by ICP-MS is the ability to use other sample types in addition to blood or urine5. For example, the use of laser ablation coupled with ICP-MS detection can allow the analysis of various samples such as nail and hair in clinical or forensic toxicology analysis5,40,47. Blood and urine usually reflect exposure in the last days or hours5. Hair is a cumulative biomarker for longer term exposure compared to blood or urine. Each centimeter of hair represents one-month of exposure and can therefore be used to check for a longer window of exposure in clinical and forensic toxicology investigations. Hair can be used in conjunction with blood or urine results to differentiate a single exposure from chronic exposure by comparison with hair samples from a given growth period5. Alternatively, nails are another biomarker for forensic metals analysis by ICP-MS. Nails incorporate elements from blood during linear growth and thickening, providing a window of detection spanning 3 to 5 month for toxic metal exposure5. In clinical toxicology, nail collections are also considered non-invasive and contain more disulfide groups which help incorporate higher metal content, making it a preferred matrix for metals analysis for a longer window of detection when hair is not available due to balding or other reasons (e.g. religious reason)5. Lastly, tissue and biopsies for metals analysis by ICP-MS becomes important when blood and urine are not available and hair and nails are affected by external contamination, or when specific organs biopsies need to be checked for metal accumulation5.Go to:
CONCLUSIONS
In summary, mass spectrometry (MS) is a powerful analytical technique able to distinguish ionizable chemical compounds or elements based on their m/z ratio in the gas phase. With exceptional sensitivity, accuracy, precision, and dynamic range, MS has emerged as an important tool in analytical determinations of poisons and their metabolites in clinical, forensic, and environmental toxicological evaluations. GC-MS is commonly used for general unknown screen (GUS) of poisons, drugs and their metabolites based on the capacity to identify a vast majority of chemical compounds using inter-laboratory EI-MS libraries. The limitation of GC-MS is that compounds need to be volatile or heat stable for compatibility with GC separation. This restriction often requires derivatization of non-volatile compounds for compatibility with GC separation and limits analysis of heat labile compounds which often includes drugs and their metabolites. LC-MS overcomes these limitations by using ESI to introduce ions from liquid samples into the MS for analysis of non-volatile and heat labile compounds. As such, LC-MS is slowly replacing GC-MS for the analysis of poisons, drugs, and their metabolites. Disadvantages of LC-MS include high cost and the inability to use inter-laboratory spectra for compound identification. To date, both GC/LC-MS are used in advanced laboratories along with MS/MS and MSn applications for increased specificity in drug identification, drug metabolite analysis, and structural determination. Lastly, ICP-MS is commonly used for trace and toxic metal analysis in toxicology laboratories. A key advantage of ICP-MS is the ability to do multi-element panels in toxicological analysis along with the use of MS/MS, HR-MS, and DRC applications for resolving interfering compounds. Overall, MS is a versatile analytical tool with many useful applications and has the potential for automation. In general, trends for adopting MS applications for toxicology relies on the ability to multiplex quantitative and qualitative compound evaluations and hyphenated MS applications with higher mass resolution for increased analytical specificity.Go to:
Abbreviations (in alphabetical order)
ADME:
absorption, distribution, metabolism, and elimination
APCI:
atmospheric pressure chemical ionization
API:
atmospheric pressure ionization techniques
CI:
chemical ionization
CID:
collision induced dissociation
DOA:
drugs of abuse
DRC:
dynamic reaction center
EI:
electron ionization
ESI:
electrospray ionization
FDA:
food and drug administration
FS:
full scan
F T-ICR:
fourier transform ion cyclotron resonance
F T-IT:
fourier transform ion trap
FWHM:
full width at half height
GC:
gas chromatography
GC-MS:
gas chromatography mass spectrometry
GLC:
gas-liquid chromatography
HR:
high resolution
IA:
immunoassays
ICP-MS:
inductively coupled mass spectrometry
IT:
ion trap
LC:
liquid chromatography
LC-MS:
liquid chromatography mass spectrometry
m/z:
mass to charge ratio
MALDI:
matrix assisted laser desorption ionization
MRM:
multiple reaction monitoring
MS:
mass spectrometry
MS/MS and MSn:
tandem mass spectrometry
MW:
molecular weight
PAH:
polycyclic aromatic hydrocarbons
PK/PD:
pharmacokinetic/pharmacodynamics
Q1:
first quadrupole in MS instrument
Q2:
second quadrupole in MS instrument
Q3:
third quadrupole in MS instrument
QE or Q Exactive:
hydrid qudrupole-orbitrap mass spectrometer
QIT:
quadrupole ion traps
QTOF:
hybrid quadrupole time-of-flight mass spectrometer
1. Langman L. J., Kapur B. M. (2006) Toxicology: Then and now, Clin Biochem 39, 498-510. [PubMed] [Google Scholar]2. Holsapple M. P., Wallace K. B. (2008) Dose response considerations in risk assessment–an overview of recent ILSI activities, Toxicol Lett 180, 85-92. [PubMed] [Google Scholar]3. Smith M. L., Vorce S. P., Holler J. M., Shimomura E., Magluilo J., Jacobs A. J., Huestis M. A. (2007) Modern instrumental methods in forensic toxicology, J Anal Toxicol 31, 237-253, 238A-239A. [PMC free article] [PubMed] [Google Scholar]4. Viette V., Hochstrasser D., Fathi M. (2012) LC-MS (/MS) in Clinical Toxicology Screening Methods, Chimia 66, 339-342. [PubMed] [Google Scholar]5. Goulle J. P., Saussereau E., Mahieu L., Guerbet M. (2014) Current role of ICP-MS in clinical toxicology and forensic toxicology: a metallic profile, Bioanalysis 6, 2245-2259. [PubMed] [Google Scholar]6. Shannon M., Cox M. N., Baum C. R. (1998) Toxicology reviews: Immunoassay in detecting drugs of abuse, Pediatr Emerg Care 14, 372-375. [PubMed] [Google Scholar]7. Holstege C. P., Borek H. A. (2012) Toxidromes, Crit Care Clin 28, 479-+. [PubMed] [Google Scholar]8. Pappas A. A., Massoll N. A., Cannon D. J. (1999) Toxicology: Past, present, and future, Ann Clin Lab Sci 29, 253-262. [PubMed] [Google Scholar]9. Ettre L. S., Sakodynskii K. I. (1993) Tswett,M.S. And the Discovery of Chromatography .2. Completion of the Development of Chromatography (1903-1910), Chromatographia 35, 329-338. [Google Scholar]10. Pippenger C. E. (1979) Therapeutic drug monitoring: an overview, Ther Drug Monit 1, 3-9. [PubMed] [Google Scholar]11. Wen B., Zhu M. S. (2015) Applications of mass spectrometry in drug metabolism: 50 years of progress, Drug Metab Rev 47, 71-87. [PubMed] [Google Scholar]12. Glish G. L., Vachet R. W. (2003) The basics of mass spectrometry in the twenty-first century, Nat Rev Drug Discov 2, 140-150. [PubMed] [Google Scholar]13. Grebe S. K. G., Singh R. J. (2011) LC-MS/MS in the Clinical Laboratory – Where to From Here?, Clin. Biochem. Rev. 32, 5-31. [PMC free article] [PubMed] [Google Scholar]14. Garg U., Zhang Y. V. (2016) Mass Spectrometry in Clinical Laboratory: Applications in Therapeutic Drug Monitoring and Toxicology, Methods Mol Biol 1383, 1-10. [PubMed] [Google Scholar]15. Maurer H. H., Meyer M. R. (2016) High-resolution mass spectrometry in toxicology: current status and future perspectives, Arch Toxicol 90, 2161-2172. [PubMed] [Google Scholar]16. Hart-Smith G., Blanksby S. J. (2012) Mass analysis, in Mass Spectrometry in Polymer Chemistry (eds Barner-Kowollik C., Gruendling T., Falkenhagen J., Weidner S.), Wiley-VCH Verlag GmbH & Co. KGaA, Weinheim, Germany: doi: 10.1002/9783527641826.ch1. [Google Scholar]17. Nair H., Woo F., Hoofnagle A. N., Baird G. S. (2013) Why GCMS Remains an Invaluable Tool in a Toxicology Lab: A Novel Approach to Clinical Validation of a High Sensitive GCMS Platform for Urine Drug Screening, American journal of clinical pathology 140, 431-431. [Google Scholar]18. Ojanpera I., Kolmonen M., Pelander A. (2012) Current use of high-resolution mass spectrometry in drug screening relevant to clinical and forensic toxicology and doping control, Anal Bioanal Chem 403, 1203-1220. [PubMed] [Google Scholar]19. Becker J. O., Hoofnagle A. N. (2012) Replacing immunoassays with tryptic digestion-peptide immunoaffinity enrichment and LC-MS/MS, Bioanalysis 4, 281-290. [PMC free article] [PubMed] [Google Scholar]20. Strathmann F. G., Hoofnagle A. N. (2011) Current and future applications of mass spectrometry to the clinical laboratory, American journal of clinical pathology 136, 609-616. [PubMed] [Google Scholar]21. Jannetto P. J., Fitzerald R. L. (2016) Effective Use of Mass Spectrometry in the Clinical Laboratory, Clin Chem 62, 92-98. [PubMed] [Google Scholar]22. Adaway J. E., Keevil B. G., Owen L. J. (2015) Liquid chromatography tandem mass spectrometry in the clinical laboratory, Ann Clin Biochem 52, 18-38. [PubMed] [Google Scholar]23. Lynch K. L., Breaud A. R., Vandenberghe H., Wu A. H. B., Clarke W. (2010) Performance evaluation of three liquid chromatography mass spectrometry methods for broad spectrum drug screening, Clin Chim Acta 411, 1474-1481. [PMC free article] [PubMed] [Google Scholar]24. Chauhan A., Goyal M. K., Chauhan P. (2014) GC-MS Technique and its Analytical Applications in Science and Technology, J. Anal. Bioanal. Tech. 5, 222. [Google Scholar]25. Yuan C., Chen D., Wang S. H. (2015) Drug confirmation by mass spectrometry: Identification criteria and complicating factors, Clin Chim Acta 438, 119-125. [PubMed] [Google Scholar]26. Vogeser M. (2003) Liquid chromatography-tandem mass spectrometry – Application in the clinical laboratory, Clin Chem Lab Med 41, 117-126. [PubMed] [Google Scholar]27. Fernandez M. D. R., Di Fazio V., Wille S. M. R., Kummer N., Samyn N. (2014) A quantitative, selective and fast ultra-high performance liquid chromatography tandem mass spectrometry method for the simultaneous analysis of 33 basic drugs in hair (amphetamines, cocaine, opiates, opioids and metabolites), J Chromatogr B 965, 7-18. [PubMed] [Google Scholar]28. Maurer H. H. (2010) Perspectives of Liquid Chromatography Coupled to Low- and High-Resolution Mass Spectrometry for Screening, Identification, and Quantification of Drugs in Clinical and Forensic Toxicology, Ther Drug Monit 32, 324-327. [PubMed] [Google Scholar]29. Meyer M. R., Maurer H. H. (2012) Current applications of high-resolution mass spectrometry in drug metabolism studies, Anal Bioanal Chem 403, 1221-1231. [PubMed] [Google Scholar]30. Caldwell G. W., Yan Z., Tang W., Dasgupta M., Hasting B. (2009) ADME optimization and toxicity assessment in early- and late-phase drug discovery, Curr Top Med Chem 9, 965-980. [PubMed] [Google Scholar]31. Meyer M. R., Maurer H. H. (2016) Review: LC coupled to low- and high-resolution mass spectrometry for new psychoactive substance screening in biological matrices – Where do we stand today?, Anal Chim Acta 927, 13-20. [PubMed] [Google Scholar]32. Lyon T. D. B., Fell G. S., Hutton R. C., Eaton A. N. (1988) Evaluation of Inductively Coupled Argon Plasma Mass-Spectrometry (Icp-Ms) for Simultaneous Mult-Element Trace Analysis in Clinical-Chemistry, J Anal Atom Spectrom 3, 265-271. [Google Scholar]33. Mekoli M. L. (2012) Novel biological, forensic, and historical applications of inductively coupled plasma-mass spectrometry., Graduate eses and Dissertations. University of Iowa, Aimes, IA. [Google Scholar]34. Rodushkin I., Engstrom E., Baxter D. C. (2013) Isotopic analyses by ICP-MS in clinical samples, Anal Bioanal Chem 405, 2785-2797. [PubMed] [Google Scholar]35. Profrock D., Prange A. (2012) Inductively coupled plasma-mass spectrometry (ICP-MS) for quantitative analysis in environmental and life sciences: a review of challenges, solutions, and trends, Appl Spectrosc 66, 843-868. [PubMed] [Google Scholar]36. Delafiori J., Ring G., Furey A. (2016) Clinical applications of HPLC-ICP-MS element speciation: A review, Talanta 153, 306-331. [PubMed] [Google Scholar]37. Aramendia M., Rello L., Resano M., Vanhaecke F. (2013) Isotopic analysis of Cu in serum samples for diagnosis of Wilson’s disease: a pilot study, J Anal Atom Spectrom 28, 675-681. [Google Scholar]38. Resano M., Aramendia M., Rello L., Calvo M. L., Berail S., Pecheyran C. (2013) Direct determination of Cu isotope ratios in dried urine spots by means of fs-LA-MC-ICPMS. Potential to diagnose Wilson’s disease, J Anal Atom Spectrom 28, 98-106. [Google Scholar]39. Russell R. D., Estrera K. A., Pivec R., Mont M. A., Huo M. H. (2013) What’s New in Total Hip Arthroplasty, J Bone Joint Surg Am 95A, 1719-1725. [PubMed] [Google Scholar]40. Ghazi A. M., Wataha J. C., O’Dell N. L., Singh B. B., Simmons R., Shuttleworth S. (2002) Quantitative concentration profiling of nickel in tissues around metal implants: a new biomedical application of laser ablation sector field ICP-MS, J Anal Atom Spectrom 17, 1295-1299. [Google Scholar]41. Chandramouli K., Steer C. D., Ellis M., Emond A. M. (2009) Effects of early childhood lead exposure on academic performance and behaviour of school age children, Arch Dis Child 94, 844-848. [PubMed] [Google Scholar]42. Rodriguez-Farre E., Testai E., Bruzell E., De Jong W., Schmalz G., Thomsen M., Hensten A. (2016) The safety of dental amalgam and alternative dental restoration materials for patients and users, Regul Toxicol Pharm 79, 108-109. [PubMed] [Google Scholar]43. Samanta G., Sharma R., Roychowdhury T., Chakraborti D. (2004) Arsenic and other elements in hair, nails, and skin-scales of arsenic victims in West Bengal, India, Sci Total Environ 326, 33-47. [PubMed] [Google Scholar]44. Cho E. A., Lee W. S., Kim K. M., Kim S. Y. (2008) Occupational generalized argyria after exposure to aerosolized silver, J Dermatol 35, 759-760. [PubMed] [Google Scholar]45. East B. W., Boddy K., Williams E. D., Macintyre D., Mclay A. L. C. (1980) Silver Retention, Total-Body Silver and Tissue Silver Concentrations in Argyria Associated with Exposure to an Ant-Smoking Remedy Containing Silver Acetate, Clin Exp Dermatol 5, 305-311. [PubMed] [Google Scholar]46. Rosenman K. D., Moss A., Kon S. (1979) Argyria – Clinical Implications of Exposure to Silver-Nitrate and Silver-Oxide, J Occup Environ Med 21, 430-435. [PubMed] [Google Scholar]47. Chaudhuri S. N., Butala S. J., Ball R. W., Braniff C. T. (2009) Pilot study for utilization of dried blood spots for screening of lead, mercury and cadmium in newborns, J Expo Sci Environ Epidemiol 19, 298-316. [PubMed] [Google Scholar]
Future Market Insights has announced the addition of the “Fluorescence Spectroscopy Market” report to their offering
This press release was orginally distributed by SBWire
Valley Cottage, NY — SBWIRE — 05242019 — At present, there are various diagnostic techniques available for the diagnosis of medically important microorganisms like viruses, bacteria, parasites, and fungi. But, these techniques are time-consuming with some limitations or inconvenience. Fluorescence spectroscopy seems to be a promising emerging diagnostic technique with fast and rapid diagnosis ability which can be used in many filed of medical sciences. Fluorescence spectroscopy is a method which is used to analyze the sample fluorescence properties by determining the concentration of an analyte in a sample. Fluorescence spectroscopy is extensively used for measuring compounds in a solution and is usually considered an easy method to perform. Fluorescence spectroscopy is a kind of electromagnetic spectroscopy which examines fluorescence from a sample. In fluorescence spectroscopy, a specific wavelength light band is usually passed through a solution, which emits the light into a detector through a filter for measurement. The amount of light absorbed by the sample and the amount of light that is emitted by the sample can be quantified. There are generally five parameters measured in fluorescence spectroscopy and they are emission spectrum, excitation spectrum, decay times, quantum yield, and anisotropy.
Fluorescence Spectroscopy Market: Drivers and Restraints
Fluorescence spectroscopy market is expected to show a noteworthy growth over the forecast period due to the increasing adoption of new and advanced technologies among the targeted population. Furthermore, continues advancement in the fluorescence spectroscopy equipment’s and competition among the fluorescence spectroscopy market players are some of the other factors which are driving the growth of the global fluorescence spectroscopy market. However, there are some factors responsible for hampering the growth of the global fluorescence spectroscopy market. Factors such as the fluorescence spectroscopy devices are expensive and provide less focus on developing new techniques due to lack of awareness and less profitability. These are some of the factors that could impede and drive the growth of the global fluorescence spectroscopy market.
Bioimpedance spectroscopy BIS is better than a tape measure for assessing a woman's risk for developing lymphedema after breast cancer surgery, according to interim results of a study led by Sheila Ridner, PhD, RN, Martha Ingram Professor and director of the PhD in Nursing Science Program at Vanderbilt University School of Nursing. The multisite international study compares the two methods for identifying women who should be prescribed compression sleeves and gauntlets to reduce lymphatic fluid in the arm and prevent progression to lymphedema. BIS surveillance reduced rates of progression by approximately 10%, a clinically meaningful improvement. Interim findings from the study were published May 3 in Annals of Surgical Oncology and Ridner presented the analysis during the annual meeting of The American Society of Breast Surgeons in Dallas. The bioimpedance device measures lymphatic fluid, and the tape measures everything. It takes more lymphatic fluid to make your whole arm volume change than it does to make the device pick up changes. The device is just more sensitive to changes in lymphatic fluid." Sheila Ridner, researcher with Vanderbilt-Ingram Cancer Center Breast cancer related lymphedema affects between 20% and 30% percent of women due to damage to the lymph glands from surgery, radiation and some medicines, Ridner said. Lymphedema causes swelling in the arm, can be physically debilitating and puts women at greater risk for infections as well as psychological stress. The results are an interim analysis of an ongoing controlled trial called PREVENT, launched in 2014 and led by Ridner. The analysis involved 508 participants who had been monitored for a year or longer. Participants identified at risk for lymphedema received compression sleeves and gauntlets and were instructed to wear them 12 hours daily for 28 days to prevent progression to lymphedema. Patients who developed lymphedema reached their endpoint with the trial and were referred to clinicians for complex decongestive physiotherapy CDP. "CDP is resource intensive and costly," Ridner said. "Lymphedema therapists are not accessible everywhere and mostly are in metropolitan areas. You go an hour-and-a-half in any direction outside of Nashville, for example, and we can't find people to treat these patients." Clinicians have traditionally used tape measures to monitor breast cancer patients for lymphedema, but that method can vary greatly depending upon how a clinician does this. "Tape measure is the most commonly used method around the world even though it is fraught with error," Ridner said. "To get accurate measurements for a research study, there is an incredible amount of training to teach all the sites in this international study how to measure the same way. I do annual fidelity oversight visits to every single site to make sure there has not been any slippage in the protocol." BIS is a painless and noninvasive procedure that entails running an electronic signal through the body. The technology is similar to electronic monitors for body mass index, but much more refined. Although the study showed that participants in the BIS experienced reduced rates of progression to lymphedema requiring CDP, the tape measure group triggered an intervention more often and earlier. The median time that triggered an intervention in the tape measure group was 2.8 months versus 9.5 months for the BIS group. "It is possible that at three months post-surgery in some patients there remains a generalized, whole-arm inflammatory response that is identified by tape measure," the analysis states. "reased extracellular fluid may not be a major factor in that volume change." Ridner and the research team will evaluate the factors associated with triggering for both groups going forward. "We had statistically significant more people trigger an intervention that were in the tape group than in the BIS group, which was contrary to what many people thought would have happened in the study. One of the concerns about BIS in general was that it might generate false positives and we might psychologically distress people," Ridner said. "That was never my experience in the 15 to 16 years I've been working with the technology." The PREVENT trial has enrolled a total of 1,201 participants with 325 of them being patients of the Vanderbilt Breast Center. The findings released at the annual meeting of the American Society of Breast Surgeons involved the first 500 to have been monitored for 12 months or longer. The trial is anticipated to continue through December 2020. Other sites involved in the trial include Alleghany General Hospital, Columbia University Medical Center, Mayor Clinic Jacksonville, Fla., University of Louisville, Macquarie University New South Wales, Australia, MD Anderson Cancer Center, University of Kansas Medical Center, Cleveland Clinic and Southeast Health Southeast Cancer Center Cape Girardeau, Mo.. Vanderbilt University Journal reference: Ridner, S. et al. 2019 A Randomized Trial Evaluating Bioimpedance Spectroscopy Versus Tape Measurement for the Prevention of Lymphedema Following Treatment for Breast Cancer: Interim Analysis. Annals of Surgical Oncology. doi10.1245s10434-019-07344-5
we’re going to talk about FTIR analysis. FTIR analysis is fourier transform infrared spectroscopy.
it’s a molecular versus an atomic analysis which means that we’re going to look at the molecule not at the individual atoms. it’s qualitative versus quantitative, however you can do quantitative analysis with it but at laboratory testing we simply do qualitative the analysis is performed in absorbance.
it can be converted to transmittance as well if you look at the screen on the left that spectra is in absorbance the screen on the right is in transmittance.
they’re just inversions of each other this is the infrared spectrometer. it has a infrared light source that is the baseline of the energy and what happens is as a sample is put into that light source and then the absorbance of that sample is what is used to measure the bonds of the carbon atoms.
FTIR analysis is handy to use for several different types of samples.
we can have powdered samples we can have solid samples we can have thin film samples and we can have liquid samples.
there are several different ways to get the sample into the FTA our one is using a potassium bromide along with a powdered sample screw it together and press it into a pellet and then we put that pellet on the rack that will go into the light path and we shine the light directly through there.
another way is with a thin film. if the sample is already thin or it can be pressed into a thin film we put it in this cassette and then we put the cassette in the light path and we read the analysis from that we could also do nujol which is liquids.
they’re placed on a sodium chloride plates put two of them together with the liquid between it and shine a light path through there. put it in that holder and we can measure that material in liquid form through the glass plates.
another sampling method is attenuated total reflectance and that lets us put a solid sample on top of a crystal and then we tighten down the clamp so that the solid sample is held in tight proximity to the crystal and then the IR light is bounced off of that and we sample the material and that method the first thing that we’re going to do when we do an analysis is gather a background spectra, so that can be subtracted from the spectra that we get so that all we’re seeing is the actual sample. that’s gathered once the background spectra is collected then we’re ready to do an analysis this is a 10 you ated total reflectance mode we have a piece of material that is supposed to be polyethylene and we’re going to place that onto the spectrometer tighten down the clamp and then we’ll begin to gather the spectra for that as you can see the spectra is being gathered and from that spectra the will then run it through our libraries so that we can determine what the material is the spectrometer runs many scans at one time so that we get a good sampling of the material once it’s done then we will take it and compare it to our libraries so that we can see what the material is the spectra has been transferred to our library program and now we’re going to search through the libraries to see what material the libraries come up with once we run it through our library the library has determined that the material is polyethylene it comes up with the best match first and then decreasing percentage of matches down below and the best match was polyethylene high-density
In this technique, a small amount of finely ground solid sample is mixed with 100 times its weight of potassium bromide and compressed into a thin transparent pellet using a hydraulic press. These pellets are transparent to IR radiation and it is used for analysis. you can keep your disk with this device very easy in high accuracy position if you have this instrument for solid item you didn’t need SMART ATR 100% work and tested.
Why KBr pellet is used in IR?
KBr is used as a carrier for the sample in IR spectrum and it is optically transparent for the light in the range of IR measurement. So that no interference in absorbence would occur. KBr, has a transmittance of 100 % in the range of wave number (4000-400 cm-1). Therefore, it does not exhibit absorption in this range
What is a KBr pellet?
KBr Pellet Method. … Potassium bromide (KBr) is the commonest alkali halide used in the pellets. Cesium iodide (CsI) may also be used to measure the infrared spectrum in the 400 to 250 cm-1 low-wavenumber region.
ATR is one accessory to measure FTIR spectra. Mostly there are three types of accessories namely Transmission, ATR and specular reflectance. If you want to measure surface properties you can use this technique. This will have penetration depth of around 1 or 2 micrometers depending on your ATR crystal material.
actually ATR (Attenuated total reflection) is a unite used instead of preparation KBr disk part . It’s more efficient and give more accurate result , low signal to noise ratio . also small sample need to make analyzed, only 0.5-1 micron .
ATR is one accessory to measure FTIR spectra. Mostly there are three types of accessories namely Transmission, ATR and specular reflectance. If you want to measure surface properties you can use this technique. This will have penetration depth of around 1 or 2 micrometers depending on your ATR crystal material. I am attaching one ppt file for your reference which I have made to explain this technique to my students. In this file I have mentioned about sampling methods which will help you to understand.
Attention: All prices are auction prices.Across the United States.
We are an intermediary company to participate in the auction and all prices are rising until the last moment, We will apply your maximum offer and the final price ,will be added to our services.
----Our services include: participation in auctions, transportation, repair, tuneup and export to abroad. CONTACT US FOR MORE DETAILS. -----------------------------------------------------------PHONE : +1(248)602-6567. +1(248)587-6666 Dismiss

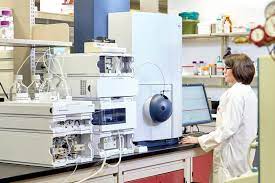

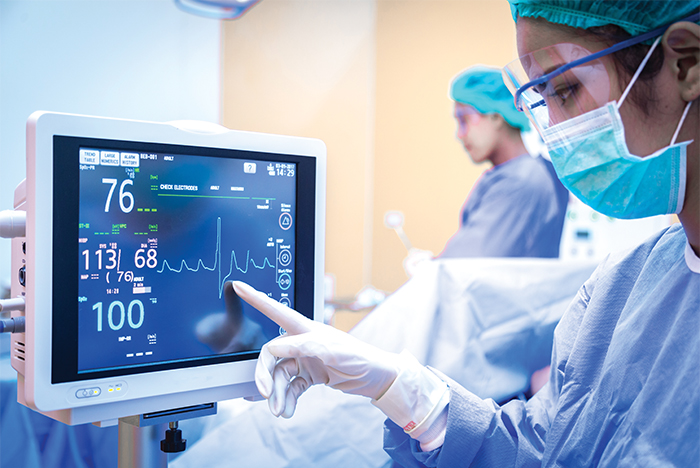


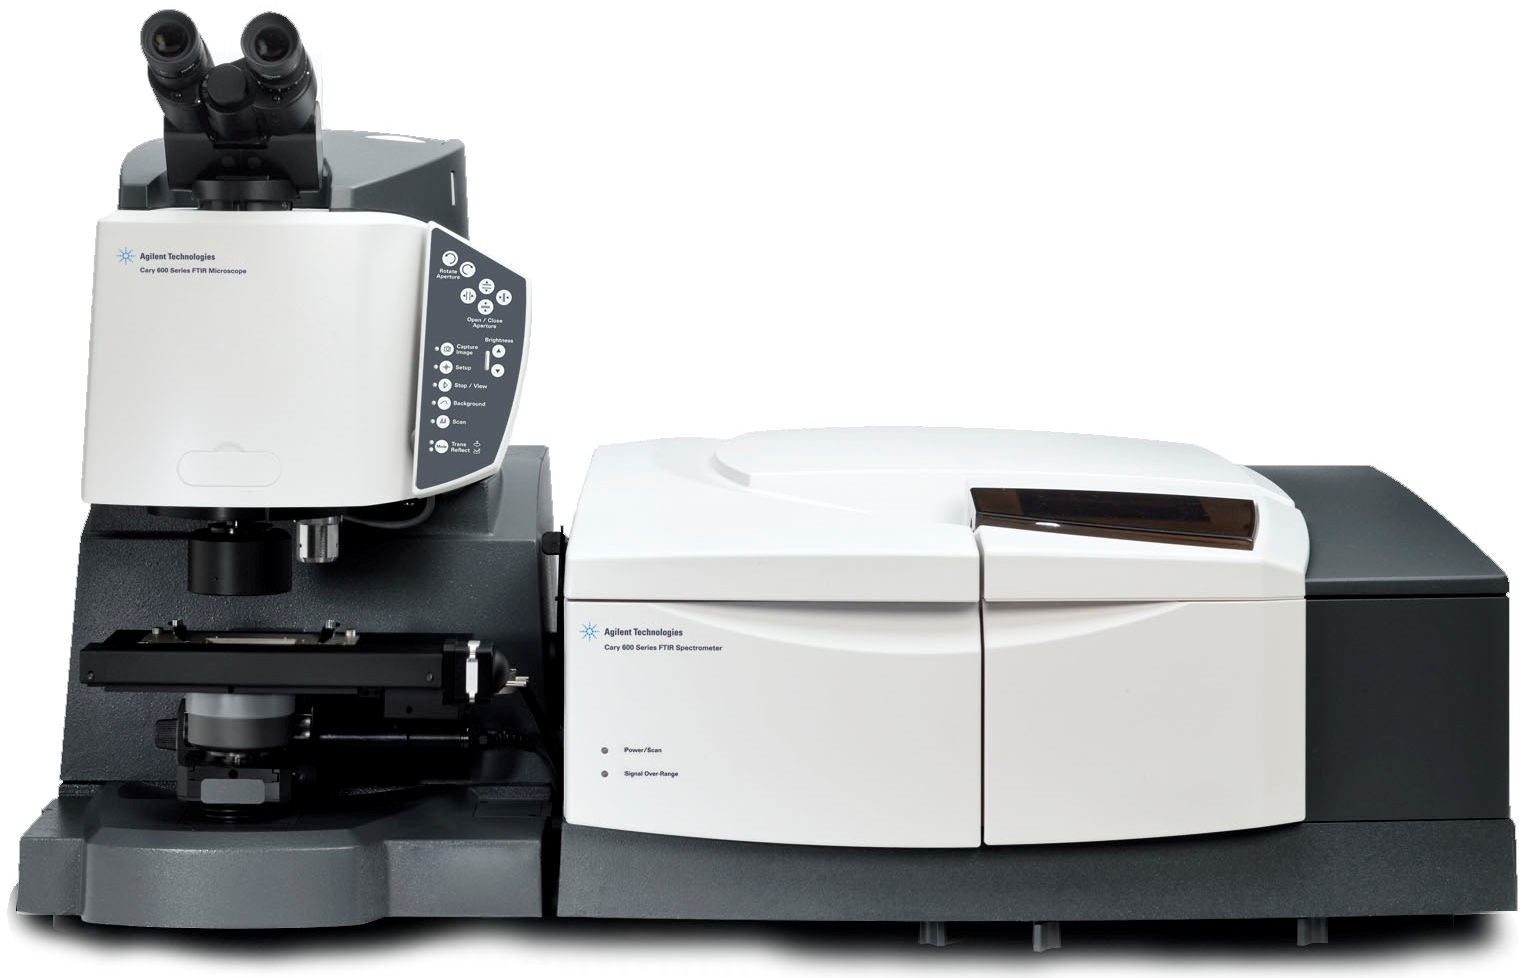


